 click
for enlarged image
click
for enlarged image|
click
for enlarged image |
|
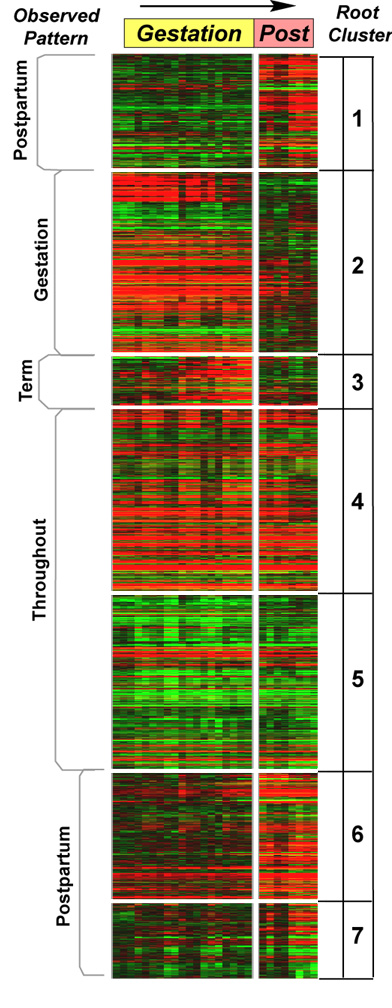
| Supplemental Fig. 2 . HOPACH Absolute Value Pearson Correlation of Myometrial Expression Data. Gene expression data used for Pearson correlation HOPACH was used to generate a new set of clusters with a metric that disregards the direction of fold change. Genes downregulated with term are identified based on association with genes upregulated at term from the non-absolute HOPACH analysis. |